
The Lineup Lowdown
Every year I go to about ten Minnesota United matches a year. I have season tickets, I keep a pulse on top players, but I have no idea about the opposing team beyond their star players. I don’t know if
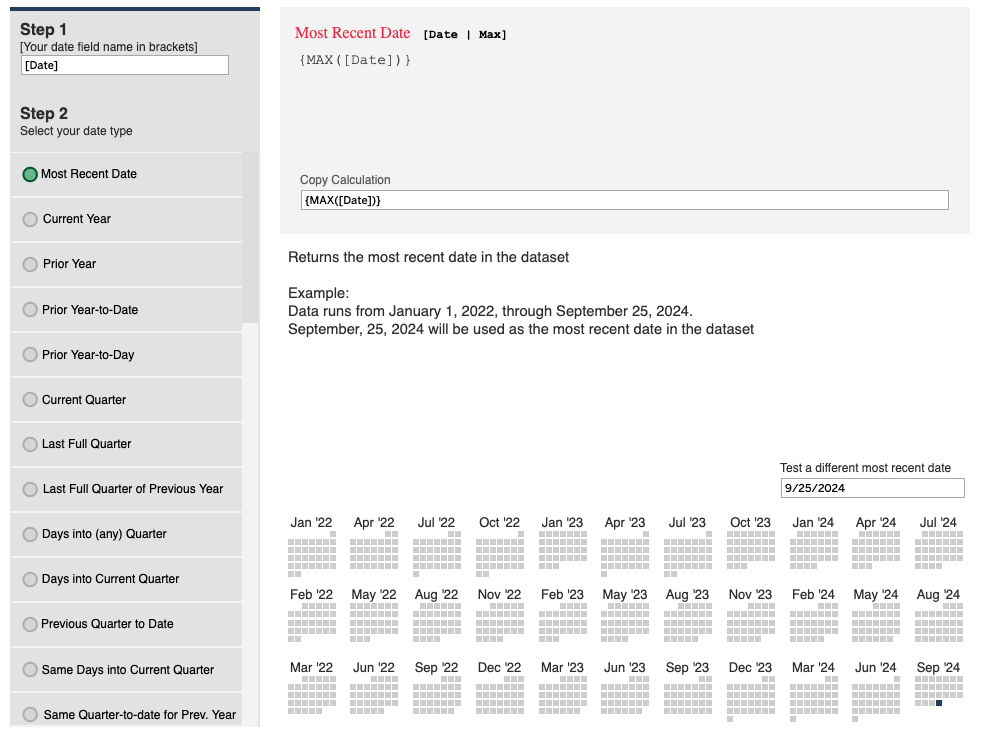
Date Calculations are hard. I’ve personally spent about 1000 hours of my life writing the same date calculations over-and-over. I decided to consolidate these into a single document to make it easy to build the calculations with a few keyboard strokes and clicks of a mouse
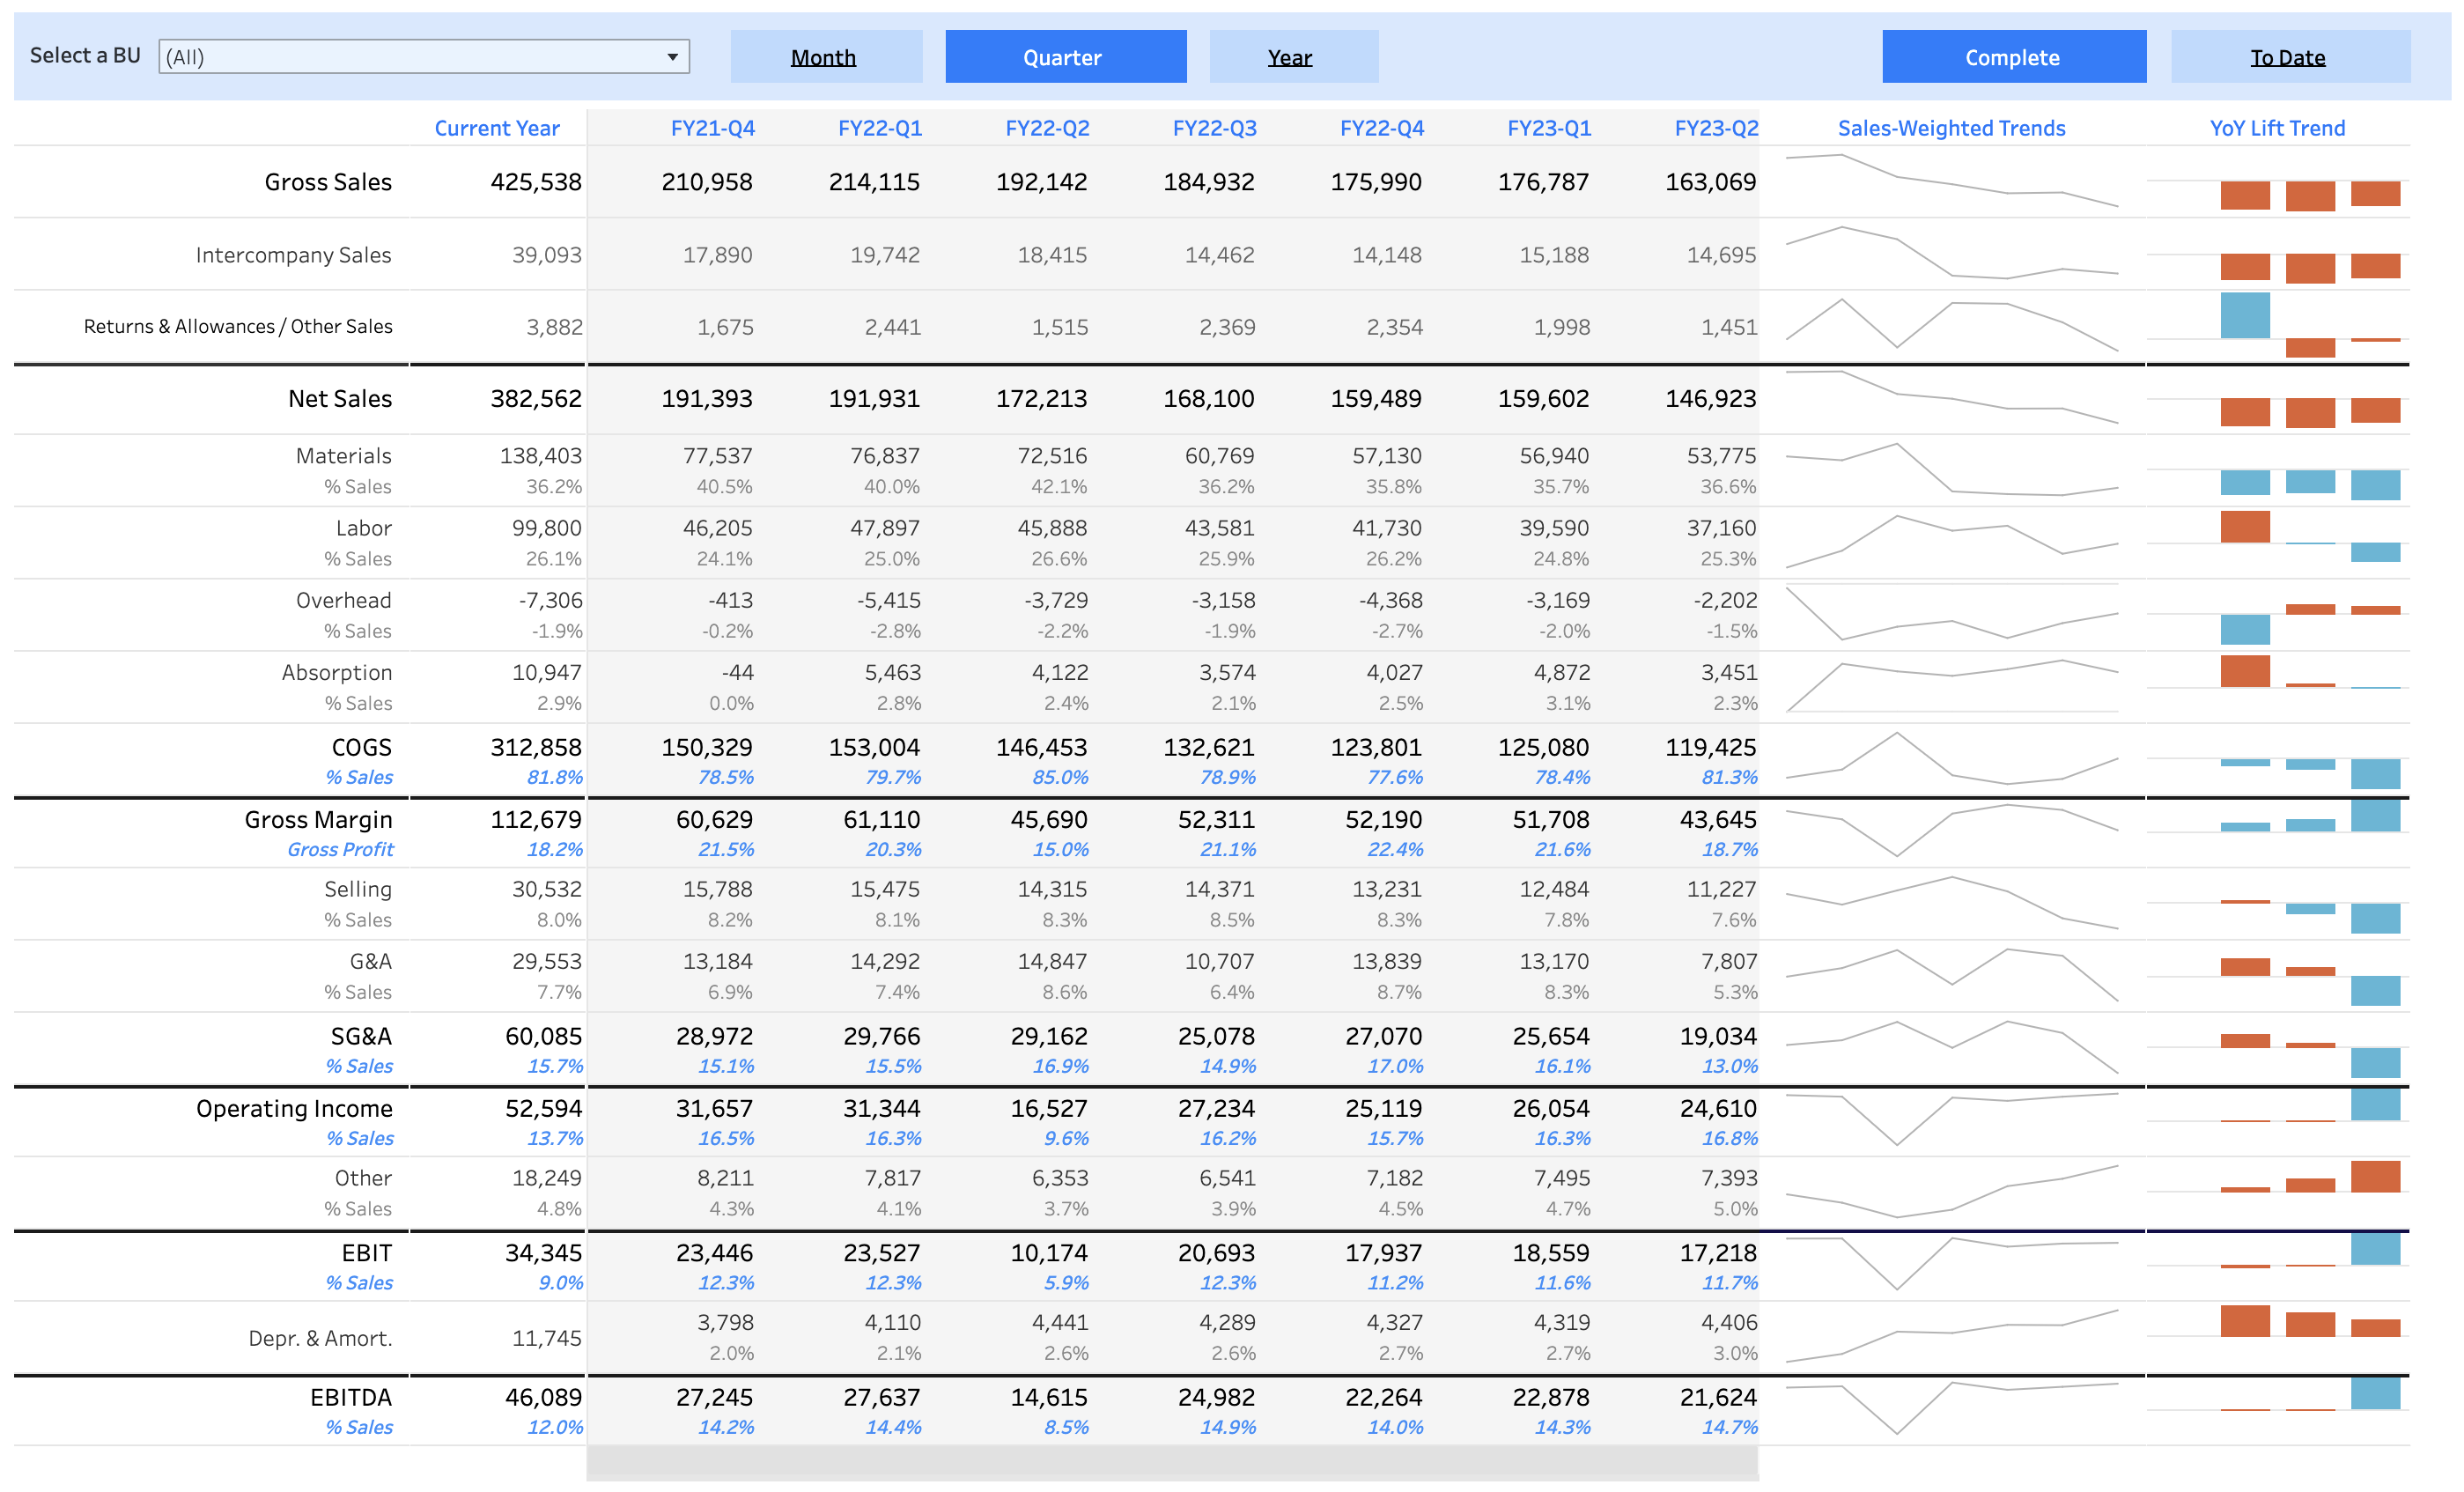
Sometimes Tableau takes a bad wrap for not being able to create the types of tables everyday users of Excel expect. This example shows how to create an income statement in Tableau.
See how the functionality added to Tableau 2022.4 creates additional functionality not previously available to users of Tableau.
Every year I go to about ten Minnesota United matches a year. I have season tickets, I keep a pulse on top players, but I have no idea about the opposing team beyond their star players. I don’t know if
A number of times I’ve been paid the compliment of being told that I am worthy of the Tableau Zen Master title. It’s an amazing compliment, but sometimes I don’t feel worthy of such compliment. Here’s why: It’s the season
I recently asked for the top tips from the Tableau community on Twitter. Anyone want to share their favorite “hidden” feature in Tableau? I’m putting them together for a small presentation! — Luke Stanke (@lukestanke) April 10, 2018 And they
Below is a chart built for #WorkoutWednesday. It seems to have thrown people off a bit. Just as a reminder here are the requirements: Use sales for 2017. The size of the dashboard 500px x 600px. If you think of
I've used Tableau just a little this year and I thought I'd share my year in Tableau AKA #DataMemories AKA #YearInTableau2017. To start the year I had simple goals when it came to all things Tableau. I'll get to those
Finished #eclipse2017 visual. Wasn't too hard. Here's image and @tableaupublic link. (tech⚠️: ~400K marks) https://t.co/kiHOp7zztW pic.twitter.com/3hyiwXLfaz — 📊 (@lukestanke) October 17, 2017 I recently put together a an orthographic map (globe-like map) of eclipse patterns visualization in Tableau that initially
Running R on the cloud isn’t very difficult. This demo shows how to get Rstudio running on Amazon Web Services. To run R on the cloud we need to initiate a machine/computer and install R – that’s all very simple.
When taking advanced analytics to the cloud you’ll need a strong understanding of your platform – whether it’s compute, storage, or some other feature. This tutorial walks you through reading to and from Amazon Web Service’s Simple Storage Service. For
Last weekend I finished up my first Sloan Sports Analytics Conference. For many in the analytics world this attending means running into big-name sports analytics figures: Bill James, Jessica Gelman, Nate Silver, Bill Barnwell, and Daryl Morey, to name a
Please be patient: loading every play from every game since 2002. Trust me, its worth the wait!
I recently presented to a local organization on setting/scaling up data science teams. We had a thoughtful one-hour conversation about the pseudo-prerequisites to accelerating the adoption of data science within an organization. Our conversation kept coming back to the same
Tableau Public now supports Google Spreadsheets. I didn’t think of this as anything special. But after I realized cloud-based spreadsheets means dashboards that can be automatically update. I set out on a way to constantly update data in Tableau. Given
Designing mobile data tools can be intimidating particularly because we think we don’t have a lot of space to tell the same story we would with other devices. The format of data tools – including dashboards – for phones can
I was curious what packages are the most downloaded from CRAN. A quick google search of “most downloaded R packages 2016” produces outdated articles (see here, here, and here). Luckily the Rstudio CRAN keeps logs of the number of users
Getting Started: The data When developing my visualization for the IronViz competition I wasn’t sure where to begin. I thought that I needed a good data that would stand out from all other competitors. From early submissions, I saw a lot of
I’ve always thought it was really awesome how some people could replicate images in Tableau. I thought I would give it a shot. I figured it’d take a long time to figure out, but it turns out it’s pretty easy
I just finished developing a presentation for Target Analytics Network showcasing geospatial and mapping tools in R . I decided to use Target store locations as part of a case study in the presentation. The problem: I didn’t have any
I wrote some code to make a voronoi diagram from point data using NOAA weather stations. The goal original goal was to find the closest weather station given any point in the US. I decided to show some examples of
It’s the end of the National Football League regular season tomorrow. With that, comes talk about who the best player — the MVP — will be. Since 2000, the MVP award has been won by 11 times by quarterbacks and
I used to go to an awesome site to get important/cool data for playing fantasy football — Advanced Football Analytics — but it was bought by ESPN and the secret sauce/important information was no longer available to me. I had
After creating charts for the outcomes of offensive possessions by series, I decided to replicate the charts for a team’s defense. Here’s the premise: the success of a team depends on offense, defense, and special teams — wow, no surprise —
[intro]”the [Green Bay] Packers are a second half team”[/intro] That was the text message I got from a friend at halftime of a recent game between Green Bay and Seattle. I disagreed. I did some web searching, and found the
Just an update on my work: Over the last year, I’ve spent significant time developing a behavior data tool for the principals of Minneapolis Public Schools. We developed the tool because it was one a of a few areas where MPS principals could use
Over the past four years I’ve worked with Rob Demovsky of ESPN analyzing the Green Bay Packers one-on-one offensive/defensive line drill. We’ve found it to be a fantastic predictor of making the team. I’m going to post some more detailed
Last fall, I spent significant time working on a data tool for schools that gathered information from many different sources. To create the tool, I had to develop reproducible code to gather information from our student information system, develop an intermediate data
Let’s face it, standardized testing has been a white hot topic since the adoption of No Child Left Behind. There have been many voices expressing distaste for testing, even questioning the validity of standardized tests in Minnesota all-together or blaming the