About/How to
If you’ve read anything about data visualization you probably have heard of Mike Bostock. He was the genius behind many great New York Times graphics and created D3.js – one of the best data visualization tools available. Recently he offered updated versions of his polar clocks, which were originally inspired by Gabriel Mak’s PolarClock screen saver. Seeing this, I challenged myself to build the clock in Tableau.
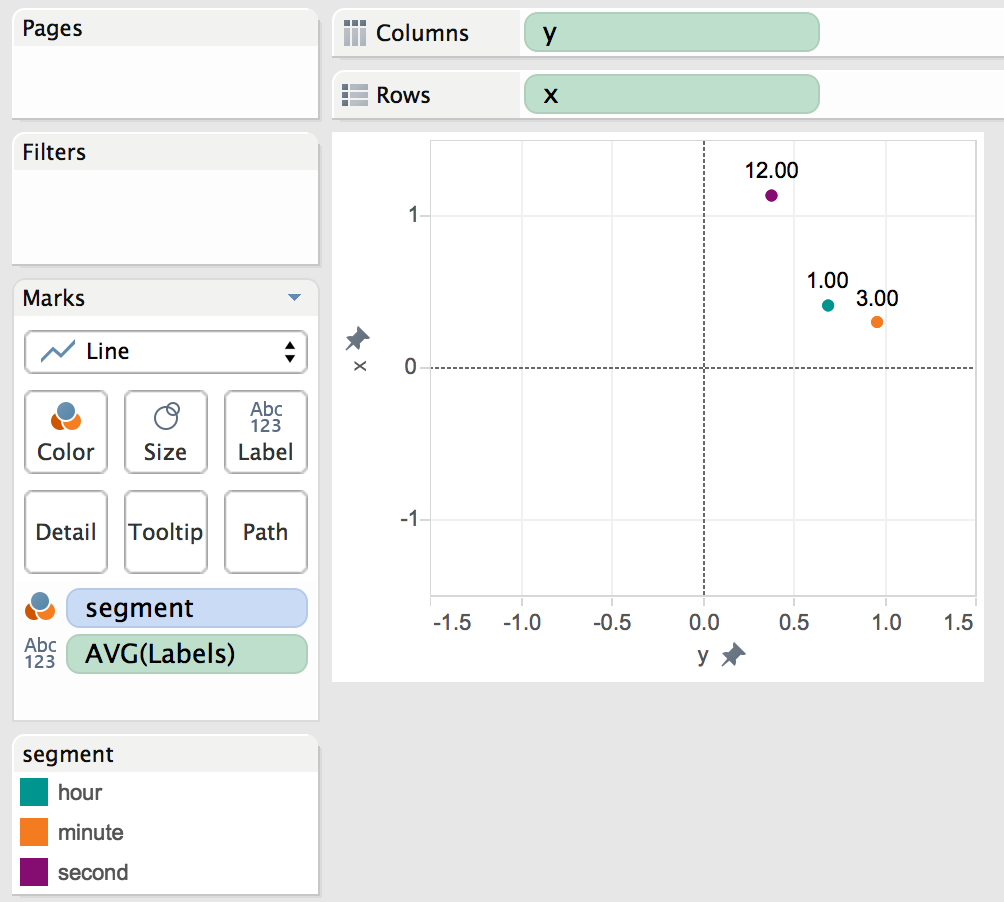
Not knowing how to do this, I decided to build a versatile dataset that could handle the job. The dataset has 606 rows, these rows are broken out in 202 row groups for hours, minutes, and seconds. Within those 202 rows, 201 are devoted to the trail/tail and 1 row is devoted to the main time location. Each row has 6 columns: 1) an index column; 2) a degrees column where row 201 for a given group is equal to 90; 3) a radius column – all values set to 1; 4) a size column – which I intended to use for setting the width of the lines, a factor column; 5) to indicate if its the main time point or the tail; 6) and segment – either hour, minute, or second.

Once loaded into Tableau. we just need to figure out the current time. This can be done with the NOW() function. Since this information is possible, we now need to get the current hour, minute, or second. Once again, Tableau has a great function called DATEPART() that can pull any part of a date out from a string. Here is how you do it for minutes:
//  Get current hour
DATEPART('minute', NOW())
After getting this information, we just need to get this information on the clock in the correct position — for the sake of this tutorial we will use degrees. On a 12 hour clock, 45 minutes will be positioned 75% of the way around the clock — or 270º from the start point. The degrees in hours is a bit more complicated — though not much, since the clock handles 12 hours, but a day is 24. I just used the modulo % function which returns the remainder in a division problem. Here are each of the variables we’ll use for further analysis later
Hour
// Hours in degrees
(((DATEPART('hour', NOW()) + (DATEPART('minute', NOW())/60)) % 12)/12)*360

[Minute]
// Minutes in degrees
(DATEPART('minute',NOW())/60)*360

[Second]
// Seconds in degrees
(DATEPART('second',NOW())/60)*360
Generally once we know this, its just a bit of geometry to identify the x and y coordinates. Here’s the general formula for finding x and y coordinates given radius and degrees:
[x]
//  Get x coordinates from degrees and radius.
[radius]*SIN(RADIANS([degrees]))

[y]
//  Get y coordinates from degrees and radius.
[radius]*COS(RADIANS([degrees]))
Since we have all of the information about hours, minutes, and seconds in a column called [segment], we need to specify the coordinates for hours minutes and seconds in one column using the CASE() function. I also want to give hours minutes and seconds each a different radius so they don’t overlap on my clock. I’m going to hard code hours to a radius of 0.8, minutes to 1.0, and seconds to 1.2. When I make my clock this will put hours on the innermost ring and seconds on the outermost ring. Here’s the code only for the x coordinates:
[X]
//  X coordinates from time.
CASE [segment]
WHEN 'hour' THEN .8*SIN(RADIANS([Hour]))
WHEN 'minute' THEN SIN(RADIANS([Minute]))
WHEN 'second' THEN 1.2*SIN(RADIANS([Second]))
END
If I create a visual using this data you’ll see it’s not anything special.
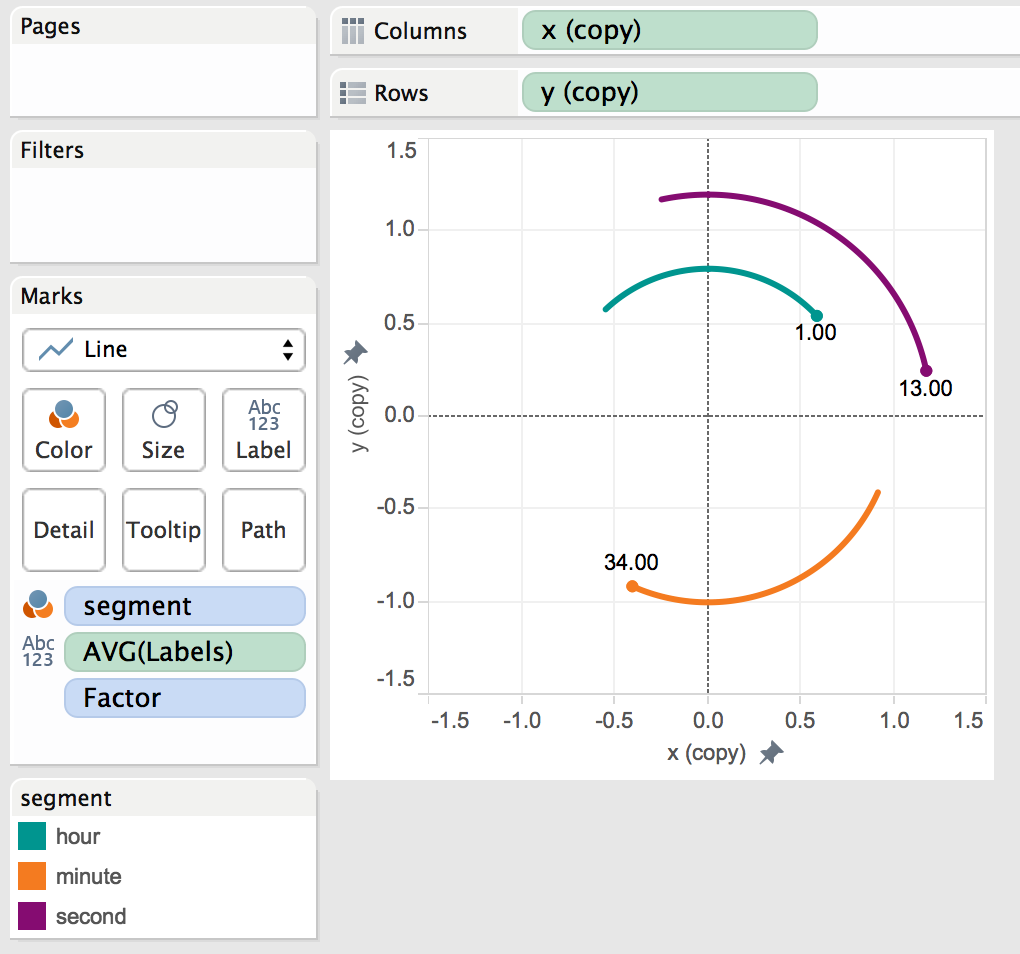
I really need to add the tail to make it interesting. I can do this by modifying the code just slightly.
[X]
//  X coordinates from time with a tail.
CASE [segment]
WHEN 'hour' THEN .8*SIN(RADIANS([Hour]-([Deg])))
WHEN 'minute' THEN SIN(RADIANS([Minute]-([Deg])))
WHEN 'second' THEN 1.2*SIN(RADIANS([Second]-([Deg])))
END
Using this function, we can begin to have something that resembles the polar clock.
This could be good enough, but we want to create a parameter to control the tail length — Let’s just call the parameter [Length] to make it easier — and set the range from 0.1 to 2. We just need to add this to our [x] variable:
[X]
//  X coordinates from time with a tail.
CASE [segment]
WHEN 'hour' THEN .8*SIN(RADIANS([Hour]-([Deg]*2*[Length])))
WHEN 'minute' THEN SIN(RADIANS([Minute]-([Deg]*2*[Length])))
WHEN 'second' THEN 1.2*SIN(RADIANS([Second]-([Deg]*2*[Length])))
END
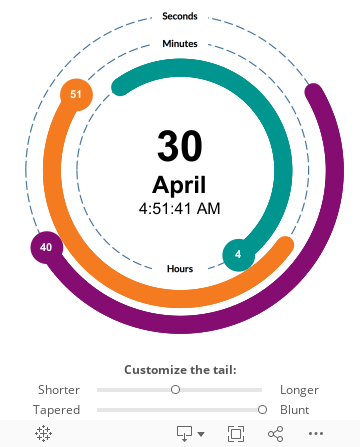
To make things easier, let’s also add a background to the chart. Here is the image i used:
If you set the min and max values to -1.5 and 1.5 for x and y it produces this chart:
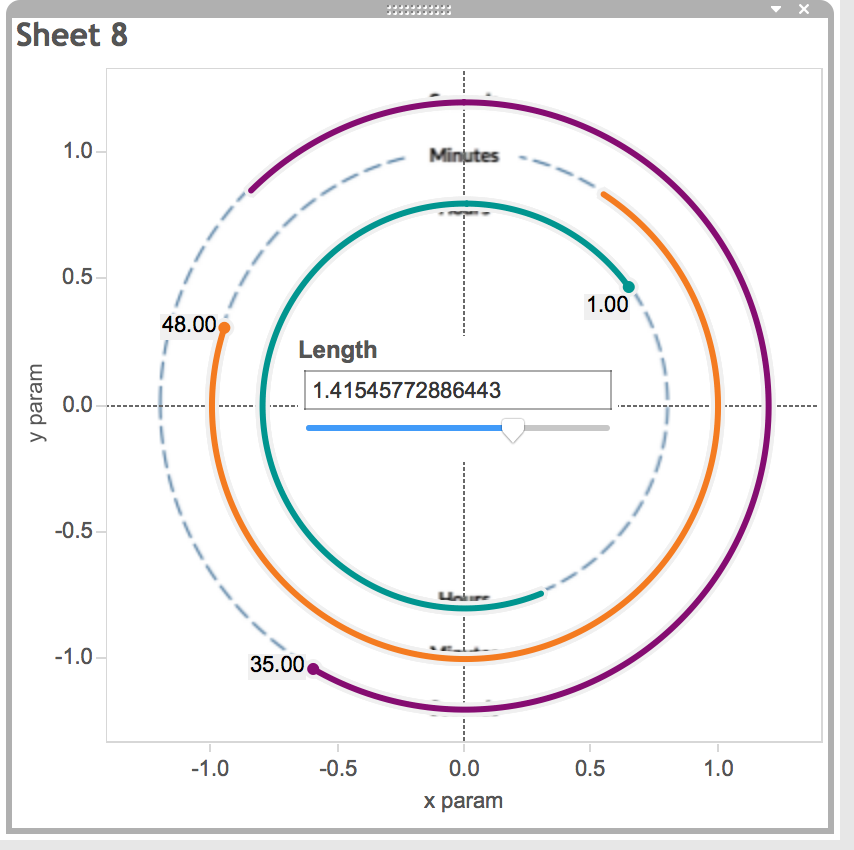
One last thing we want to add: a parameter to change the line width of the tails. We want it to either be tapered or blunt. So let’s create a [Taper] parameter where the values range from 0 to 1. Then we can write a function that uses the taper parameter:
[varied taper]
// Varies line width
([Taper]*[Size])+((1-[Taper])*(1-([Index]/202)))
Once I have all this information, I can create a polar clock with parameters to control the tail. I’ll also throw in some additional styling.
This is excellent, except one thing — the clock only has the correct time when you load it. I want it to tick. Luckily, you can do this by using Tableau’s javascript API. UPDATE: I’m providing the API script written by Allan Walker and Chris DeMartini below — Here is the article that provides some additional guidance.
  var viz, one, workbooka, activeSheet, Worksheet, worksheet;

  var onePh = document.getElementById("tableauViz1");


  var oneUrl = "https://public.tableau.com/views/PolarClock/PolarClock?:showVizHome=no&:display_spinner=no&:jsdebug=n&:embed=y&:display_overlay=no&:display_static_image=no&:animate_transition=yes"; //Polar Clock

  var oneOptions = {

      width: "105%",
      height: "112%",
      hideTabs: true,
      hideToolbar: true,

  onFirstInteractive: function () {
          }
        };

  viz1 = new tableauSoftware.Viz(onePh, oneUrl, oneOptions);
  ;

  function clock() {
    viz1.refreshDataAsync();
    setTimeout(clock, 500);
  }

  clock();
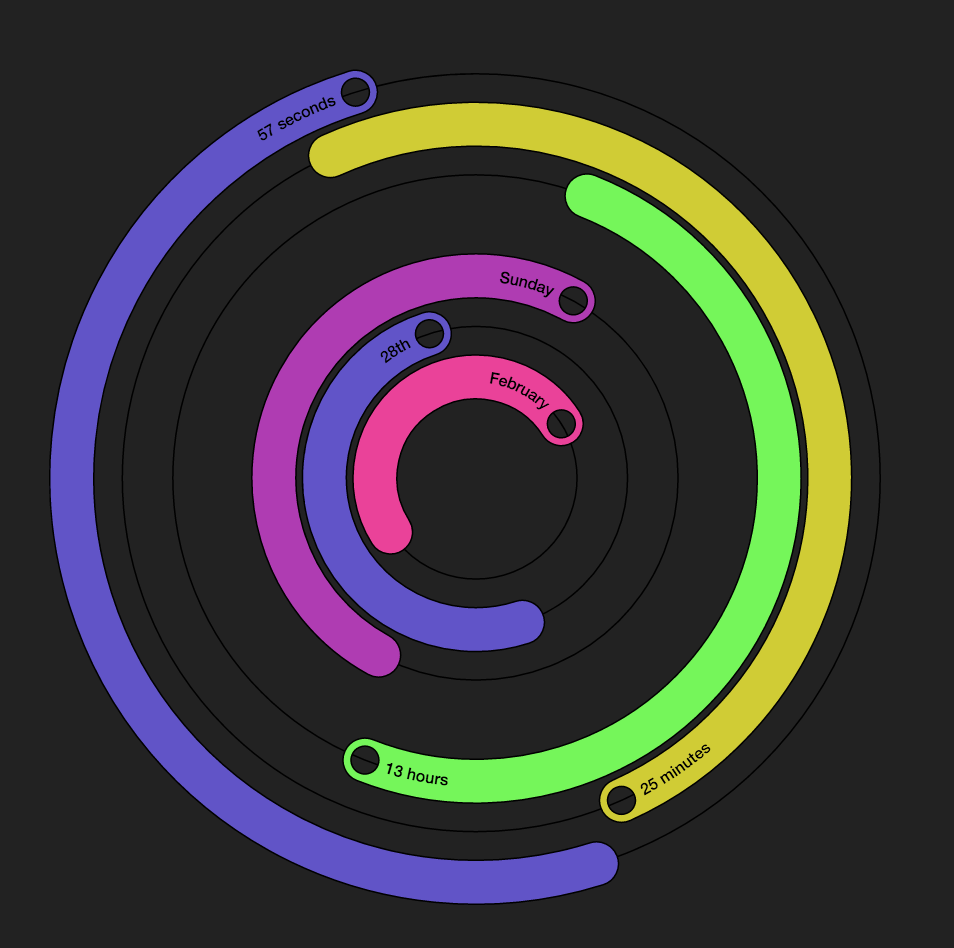
Adding this to my page — and doing some stuff to make it happen in WordPress — produced this as my final result:
One Response
Comments are closed.