I’ve always thought it was really awesome how some people could replicate images in Tableau. I thought I would give it a shot. I figured it’d take a long time to figure out, but it turns out it’s pretty easy to get key underlying data in R. After doing that you can quickly plot that information in Tableau.
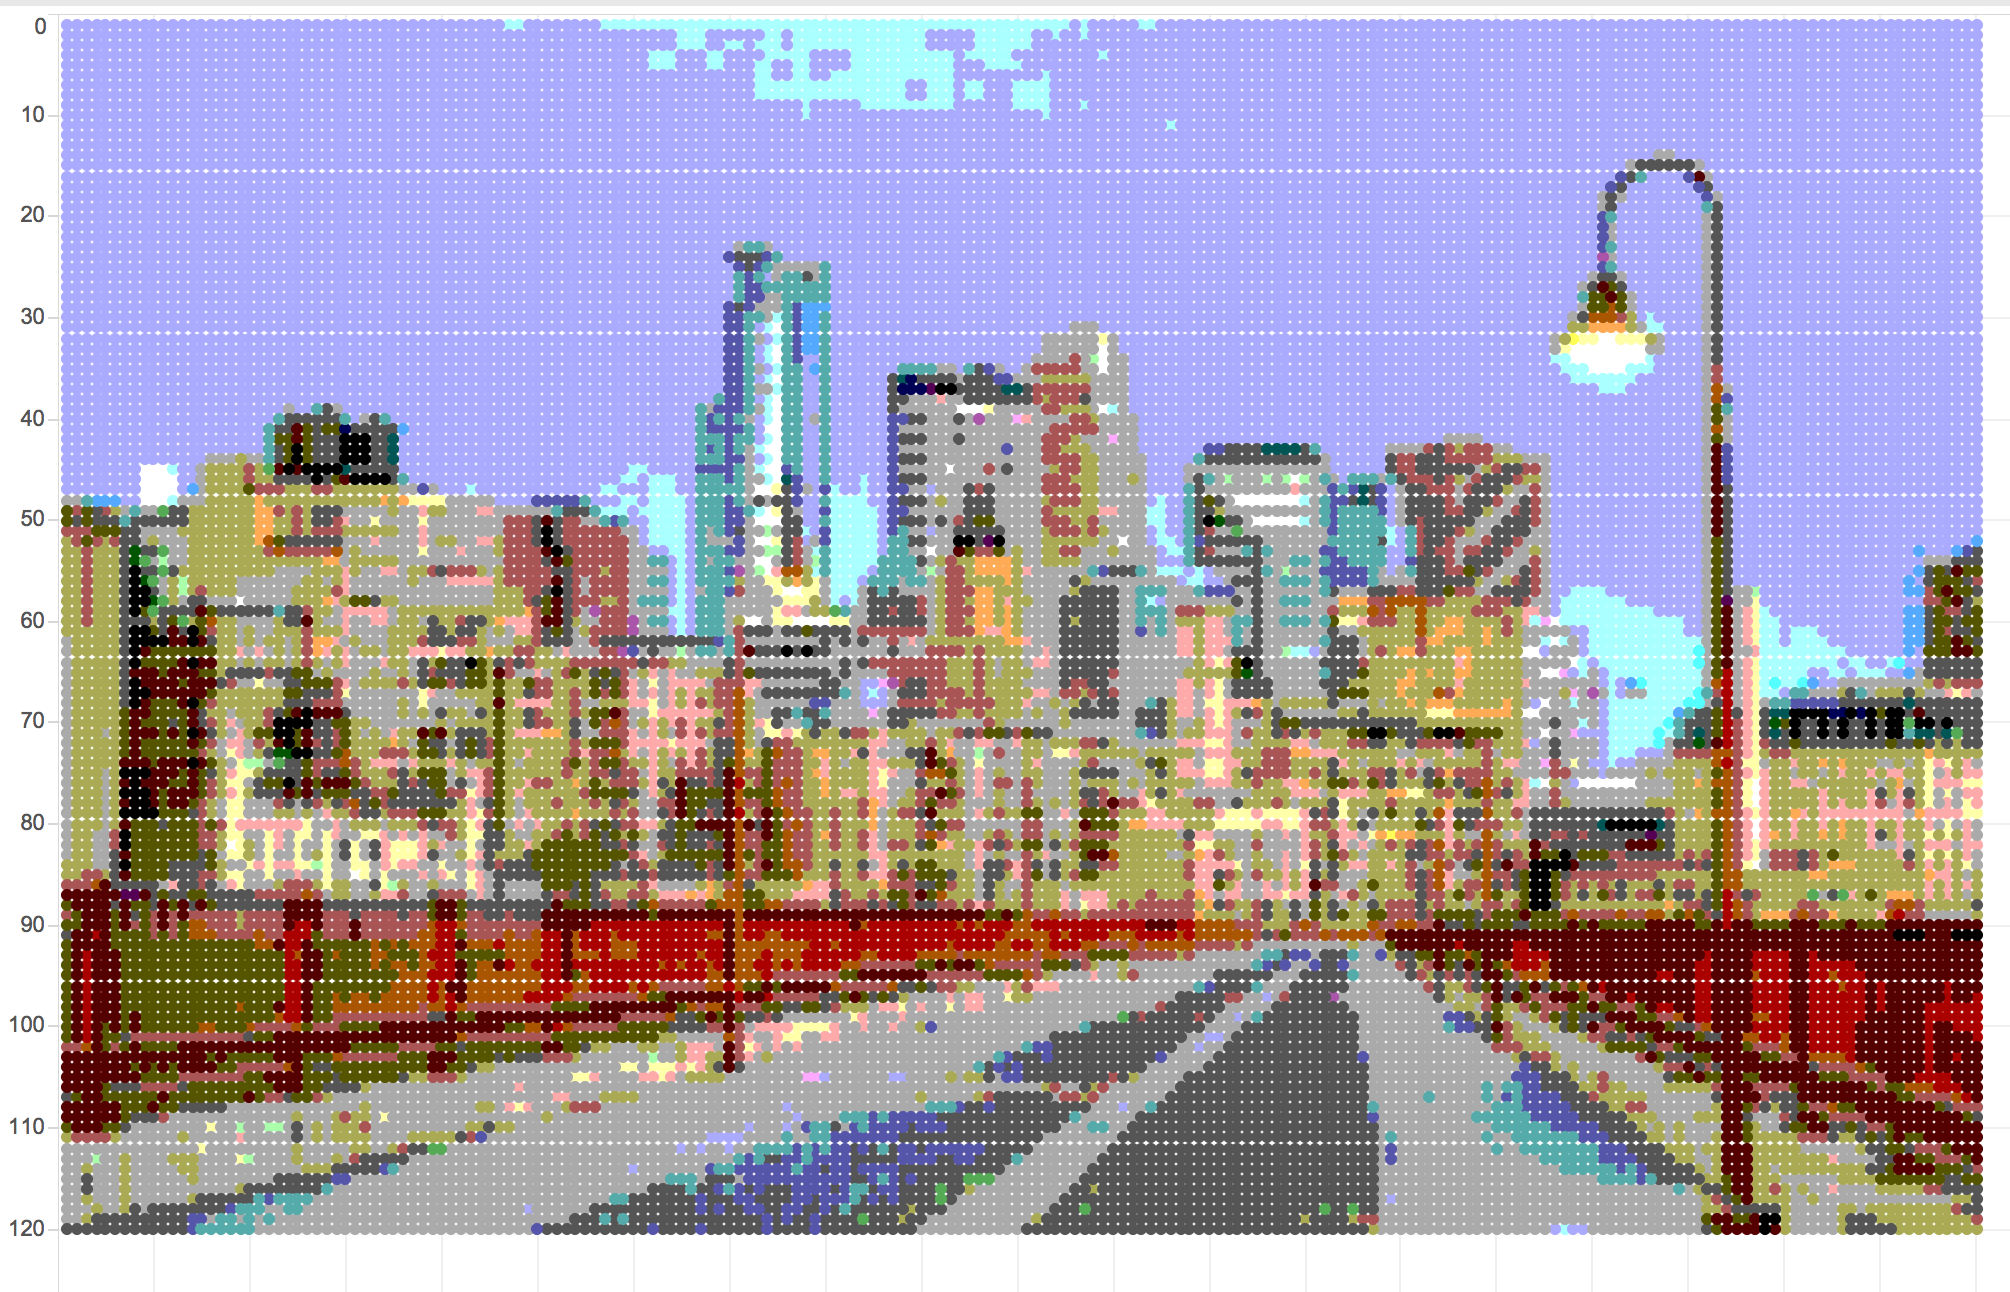
So let’s start with a photo of downtown Minneapolis:
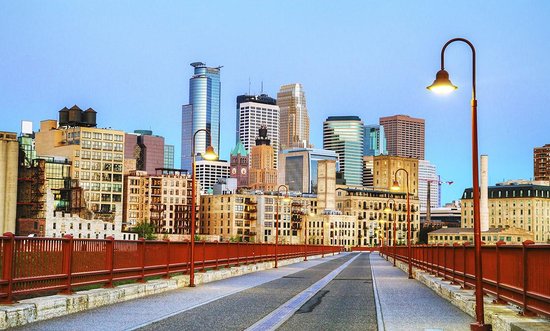
Well, I want to reduce the resolution of the photo, so I used pixlr to change the width of the photo to 200 pixels.
Once we do this we can load this photo into R. We can do that using the readPNG function which is part of the png package.
image <-
  png::readPNG('.../mpls.png')
This produces an array that is height-by-width-by-array (RGB) in size. With this information I can edit the shape of the file.
###  Create empty space for the image
image2 <-
  data.frame(
    matrix(
      NA,
      nrow = dim(image)[1]*dim(image)[2],
      ncol = 5
    )
  ) %>%
  dplyr::as_data_frame() %>%
  dplyr::rename(
    row = X1,
    column = X2,
    red = X3,
    green = X4,
    blue = X5
  ) %>%
  dplyr::mutate(
    row = image %>% dim() %>% .[1] %>% seq(1, .) %>% rep(image %>% dim() %>% .[2]),
    column = image %>% dim() %>% .[2] %>% seq(1, .) %>% rep(each = (image %>% dim() %>% .[1]))
  )

### Fill in the data
for(w in (image %>% dim() %>% .[2]) %>% seq(1, .)) {
  for(h in (image %>% dim() %>% .[1]) %>% seq(1, .)) {
    image2$red[image2$column == w & image2$row == h] <- image[h, w, 1]
    image2$green[image2$column == w & image2$row == h] <- image[h, w, 2]
    image2$blue[image2$column == w & image2$row == h] <- image[h, w, 3]
  }
}
Now let's add in the hexcolor as another column. The code I am writing allows for up to 27 levels of color. We'll also save the output
image2 %>%
  dplyr::mutate(
    red = round(red * 3, 0)/3,
    green = round(green * 3, 0)/3,
    blue = round(blue * 3, 0)/3,
    color = rgb(red, green, blue, maxColorValue = 1)
  ) %>%
  readr::write_csv('.../mpls.csv')
Now we can load this data into Tableau. Once we load it in, lets add the columns and rows into column and row pills as dimensions.
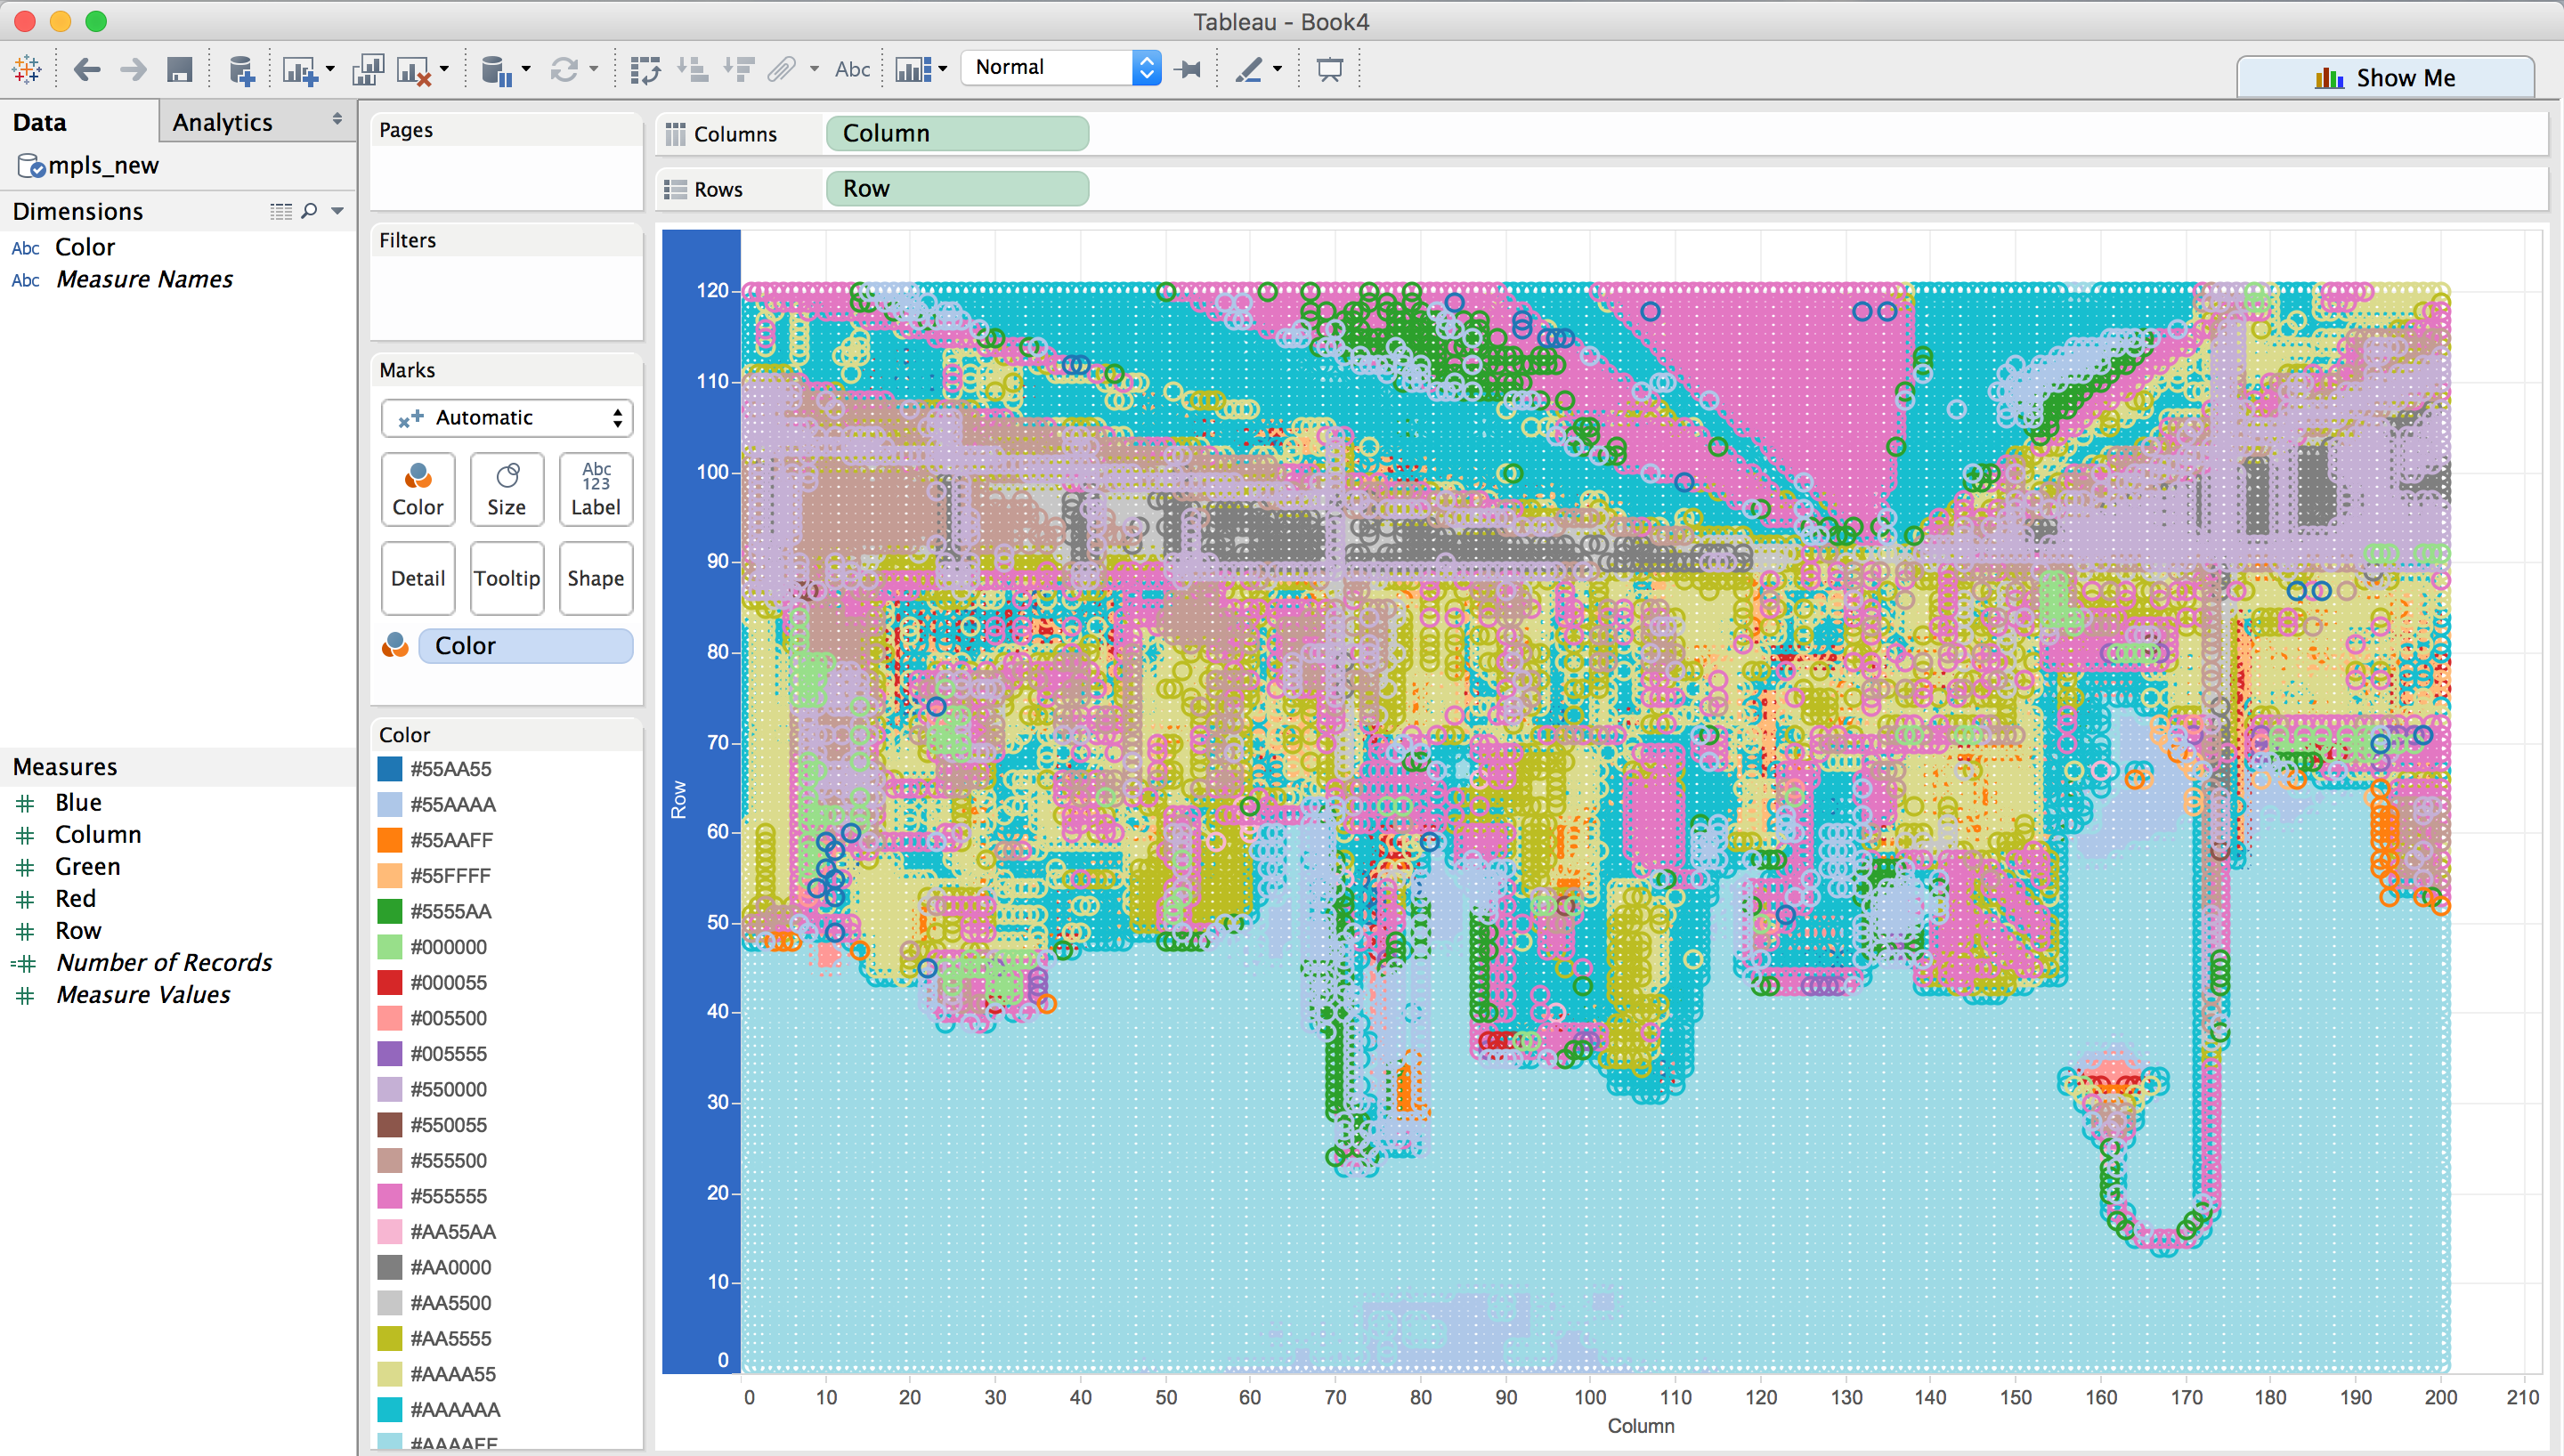
Unfortunately, my photo is upside down. There a few fixes for this, the easiest is to reverse the row axis.

Now the color of each point isn't what I am looking for, exactly, I am going to create some custom palettes that include all of the colors that are currently in the visualization. Here you can see all the colors in the graphic:
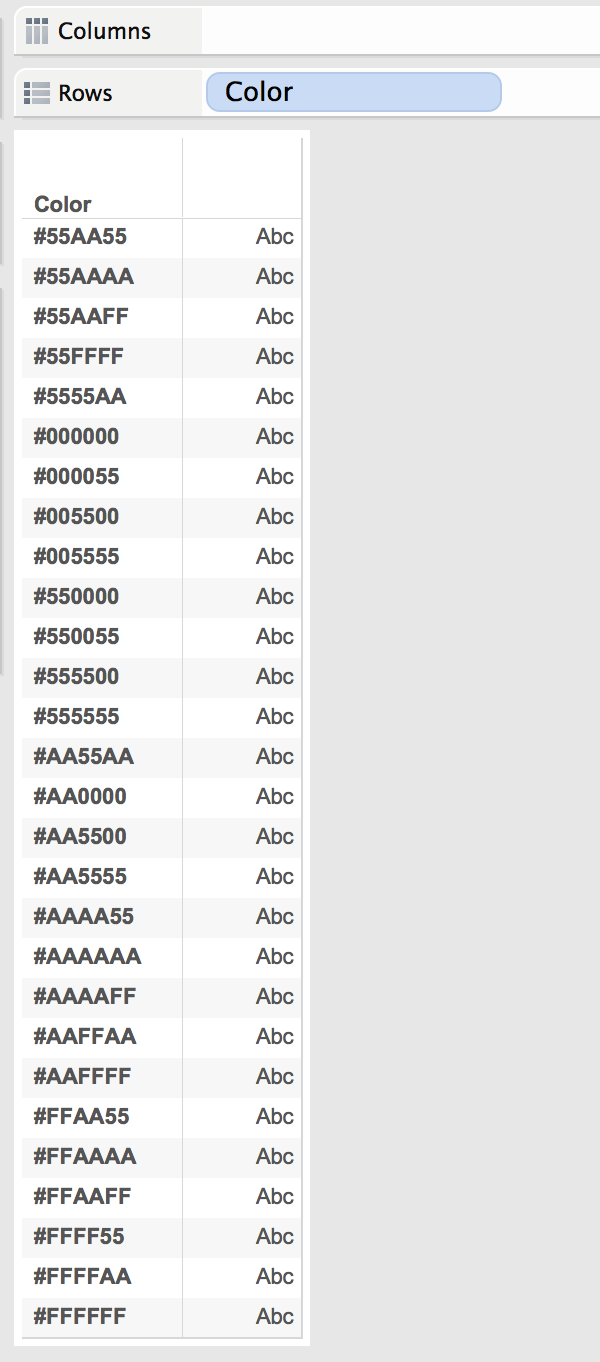
The list totals 27 colors. Since a custom palette contains 16 colors, I'm going to make 2 palettes for the colors.
If you haven't ever made a custom palette, read this document.
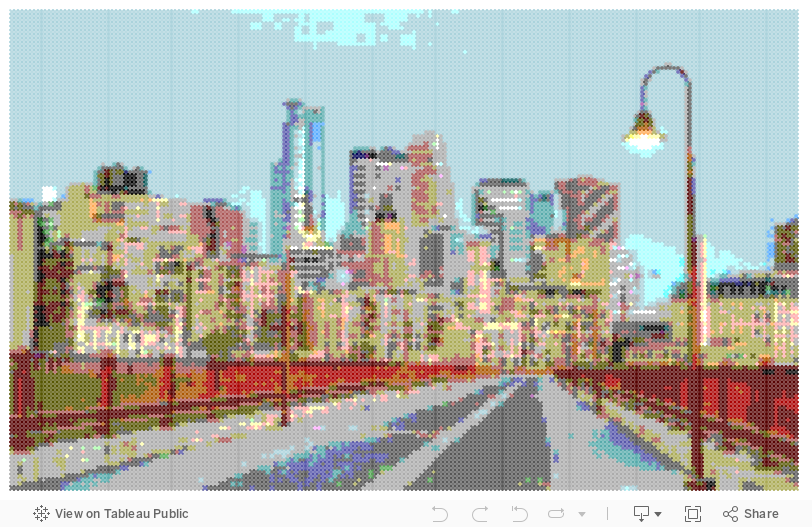
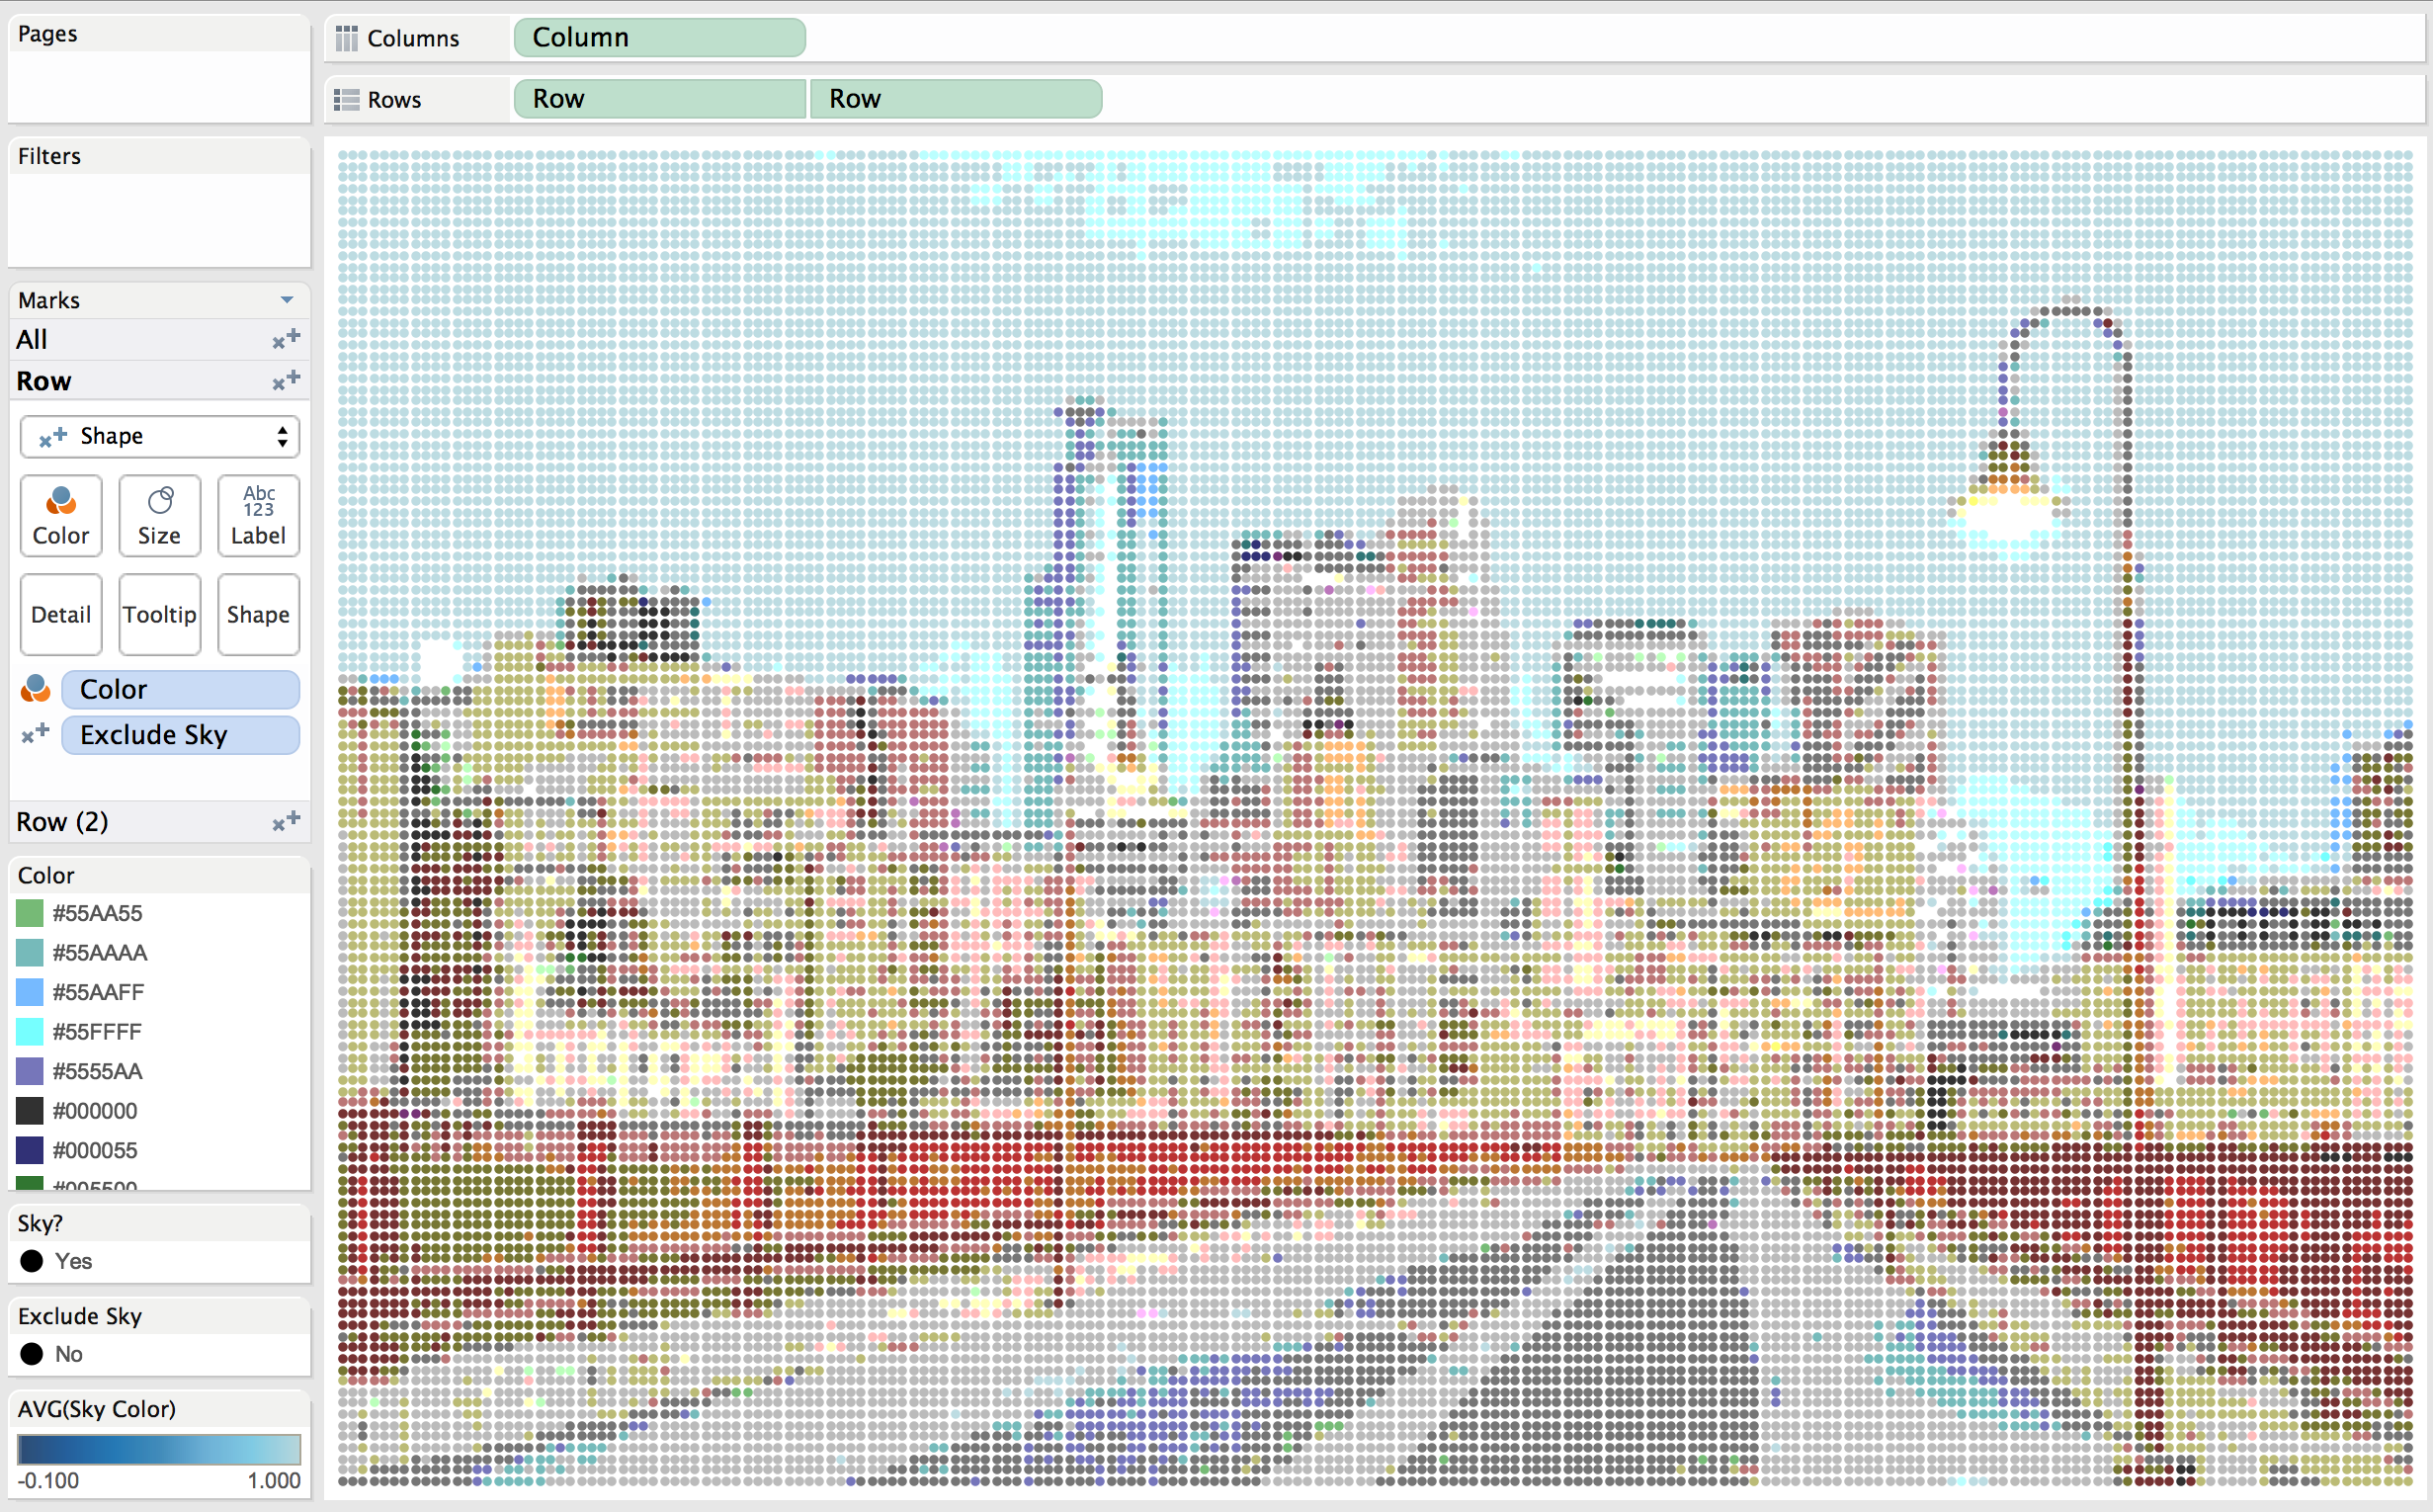
If we create the colors in the same order they are sorted in the image above, the colors will be aligned from top to bottom and it makes it easy to load the correct color to the correct shape. The color change results in this viz:
We've essentially done it! But now I want to edit the skyline so that it changes color based on the time of the day. The color of the sky is #AAAAFF. When it's mid-day, I want it to be bright blue, and when it's night I want it to be a dark blue. To do this. I need to make a dual axis chart. One chart includes all dots in the part of the sky, and another for all of the buildings.
To do this, I need to create two variables that will help sort things out later: Sky? and Exclude Sky. Both have the same formula:
IF [Color] = '#AAAAFF'
THEN 'Yes'
ELSE 'No'
END
I'm going to change the shape type for both charts to be based off of each of these variables. Then I am going to hide the sky one one viz, the buildings on the other, and then create a dual axis chart with synchronized axes.
Now lets create the sky color. I want it to start getting dark by 7PM and to be fully dark by 9PM. I also want it to start getting light by 7AM and be fully light by 9AM. I'm going to use the logit function to make this happen. Here's the function for Sky Color.
IF DATEPART("hour", NOW()) >= 12
THEN EXP((DATEPART("hour", NOW()) - 7.5)/2)/(1 + (EXP((DATEPART("hour", NOW()) - 7.5)/2)))
ELSE EXP((19.5 - DATEPART("hour", NOW()))/2)/(1 + (EXP((19.5 - DATEPART("hour", NOW()))/2)))
END
I'll make this as the color of my sky on the Sky portion of this viz. But let's make the lights show up when it's dark by creating a Modified Color variable. Here's the code:
IF DATEPART('hour', NOW()) < 7 OR DATEPART('hour', NOW()) >= 19
THEN IF [Color] = '#AAAAAA'
    THEN '#FFFFAA'
    ELSE [Color]
    END
ELSE [Color]
END
Now I'll replace the [color] variable on the color option.
Now I'll put this in a dashboard and publish it: