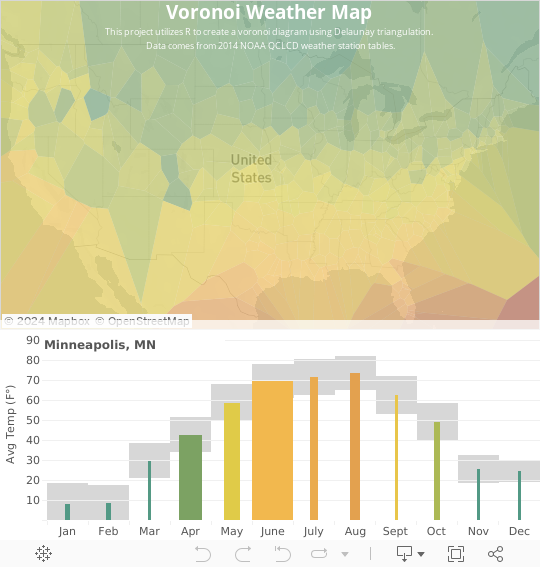
I wrote some code to make a voronoi diagram from point data using NOAA weather stations. The goal original goal was to find the closest weather station given any point in the US. I decided to show some examples of the output in Tableau – since it utilizes R.